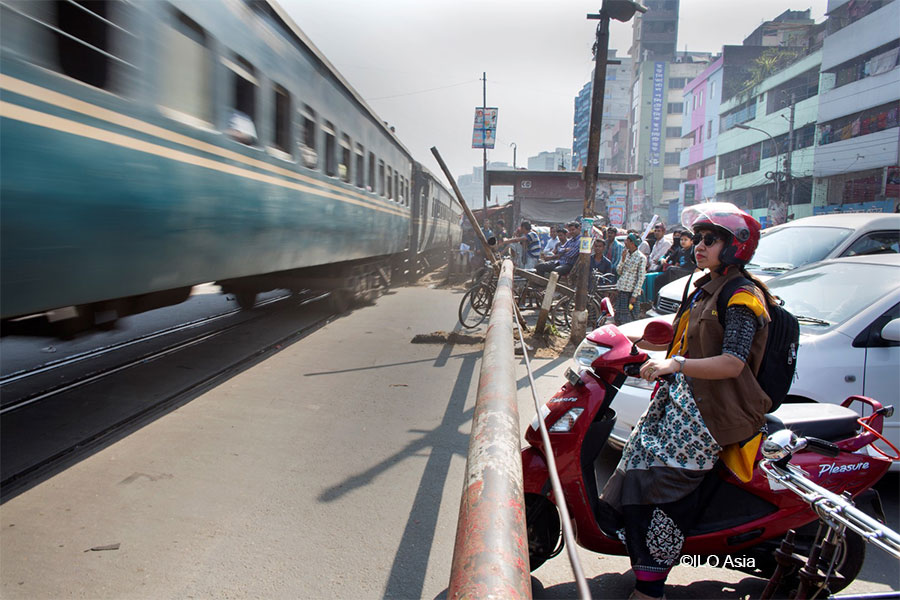
Evidence from Transport Evidence and Gap Map- Transport and the Sustainable Development Goals
As a Delhiite, I used to travel by bus (14 km) to reach my college until my graduation. I had to change two buses and it takes me approximately one hour. The problem is not the travel time, but the mismanagement of the bus services because of no schedule in place. I remember sometimes that I used to wait for more than 30 minutes for my bus, as different buses run on different routes. And overall, my journey time turns out to be more than one hour and forty minutes just for one way.

Figure 1- Delhi Metro (Source -http://www.delhimetrorail.com)
However, eventually, in the year 2002, Delhi Metro successfully started its first passenger service in Red Lines (specific route). Then the metro yellow line, which is from my college to a nearby station, started in 2004. It was not a direct one, but the metro services were extremely helpful at post-graduation time, saving me more than an hour of travel time. And now that I am working, I have realized that Delhi Metro has become an everyday part of my and other Delhiite’s life. Metro takes approximately 2,700 trips per day carrying 1.5 million passengers, who on average travel 17 kilometers each (http://www.delhimetrorail.com). This transport infrastructure has changed many people’s lives in terms of travel time, safety, and job accessibility.
Transport is one of the important areas for research as it is linked to many aspects of our life and various sustainable development goals (SDGs). As a researcher in the Campbell Collaboration, my first Evidence and Gap Map (EGM) is on the effectiveness of transport sector intervention in low- and middle–income countries.
It is important to note that the transport sector plays a key role in the achievement of many of the SDGs. Sustainable transport is a cross-cutting theme, supporting the achievement of at least 8 out of the 17 SDGs and making direct and indirect contributions to at least 13 SDG targets.

Figure 2 Social Development Goals (SDGs) (Source: https://sdgs.un.org/goals)
Lucas et al. (2016) suggest that up to 90 percent of the world’s population are transport poor, which is defined as meeting at least one of the following criteria: (1) lack of available suitable transport, (2) lack of transport to necessary destinations, (3) cost of necessary transport puts household below the income poverty line, (4) excessive travel time, or (5) travel conditions unsafe or unhealthy.
Every Delhiites, especially women will agree that they get a chance to stay out late- at least as late as the metro timings allowed. I remember clearly before, I took the last metro at 11:30 pm after attending a college festival. Before the metro services, it was difficult for women to be out that late. Now, special women’s compartments in every train added the feeling of being in a “safe space”.
The Transport EGM map found out that the evidence is concentrated to the specific region (East Asia and Pacific – China) and specific population (Urban). And the map also highlighted the countries with the highest evidence concentration such as China, mentioned above (141 studies), next is India (44 studies), and Ethiopia (16 studies).
The evidence is most concentrated on transport infrastructure, services, and use, with the greatest concentrations of sub-evidence on transport time and cost (187 studies) and transport modality (156 studies). There also include evidence on Delhi Metro and the Delhi BRT system. There is also a concentration of evidence on economic development and health and education outcomes. There are 134 studies on economic development, 88 studies on household income and poverty, and 99 studies on health.
However, the map on low- and middle-income countries identified that there are many studies on the effects of transport infrastructure, especially on roads. And there are no or fewer studies regarding ports, shipping, and waterways, and civil aviation.

Figure 3 Snapshot of the transport map
The urban transport interventions (new roads, metros, bus rapid transit) are designed to reduce urban congestion due to increase car use. These interventions provide employment and job opportunities to the population. The map highlighted that there is evidence regarding employment and migration from countries like Ethiopia, South Africa, Pakistan, Peru, Bogota, and Tanzania. (Martinez et Al (2018), Banerjee (2014), Baum (2015), Bacares (2013), Field (2018), Franklin (2015), Scholl (2018), Morten (2020).
In terms of infrastructure, Delhi also opened the BRT system in the year 2008 ahead of the commonwealth games but the system has not extended since 2016 because of the congestion and accidents (https://www.bloomberg.com/news/articles/2016-12-20/why-bus-rapid-transit-failed-in-delhi). Moreover, it was not properly managed and implemented in Delhi. On the map, we found evidence related to road infrastructure, especially on Bus Rapid Transit (BRT) systems. This is a high-quality bus-based transit system and provides dedicated lanes to buses. Figure 4 shows an example from Quito, Ecuador.

Figure 4 Bus rapid transit bus stop in Quito, Ecuador
There is evidence on BRT, particularly on the reduced travel times and the increase of use of public transport (Martinez et Al (2018), Scholl et Al (2018), Morten et Al (2020), and Solnik et Al (2018). Some evidence about women’s employment opportunities are also found. We would need systematic reviews to summarize these available evidence findings.
Centre for Science and Environment (CSE) assessment report in 2014 stated that about 16 people die and 58 are injured every hour in India due to road accidents. And Delhi has the highest number of fatal accidents among all cities, with five deaths per day. Hence, there is a growing need to reduce traffic injuries and fatalities. In our map, we also found evidence on road traffic injuries and fatalities.
The major gaps in evidence are from all types of infrastructure except roads. There is also a lack of evidence on cultural heritage and cultural diversity and very little evidence on displacement, noise pollution, and transport equity. There is a moderate amount of evidence on infrastructure quantity, location, land use and prices, market access, access to education facilities, air quality, and transport equity including cost analysis.
This EGM can guide the policymakers, and government-related agencies on transport sector interventions and their effects on many outcomes across sectors. And also, the available evidence can help deal with the issues related to travel time, congestion, pollution, infrastructure development, and prevention of road traffic injuries and fatalities. Thus, this will eventually help improve the lives of millions of daily travelers in Delhi.
The findings of this map are not yet published but its protocol is published in https://onlinelibrary.wiley.com/doi/10.1002/cl2.1136
References
Bacares CAO. Do public transport improvements increase employment and income in a city? European Regional Science Association; 2013. Available from: https://ideas.repec.org/p/wiw/wiwrsa/ersa13p1040.html
Banerjee A, Sequeira S. Transport Subsidies and Job Matchmaking in South Africa [Internet]. 2014. Available from: https://www.povertyactionlab.org/evaluation/transport-subsidies-and-job-matchmaking-south-africa.
Baum-Snow N, Vernon HJ, Turner M, Brandt L, Zhang Q. Transport Infrastructure, Urban Growth and Market Access in China [Internet]. European Regional Science Association; 2015. Available from: https://www.theigc.org/project/transport-infrastructure-urban-growth-and-market-access-in-china/
Field E, Vyborny K, Majid H, Malik A. The Impact of Public Transport on Labor Market Outcomes in Pakistan [Internet]. J-PAL; 2018 Mar. Available from: https://www.povertyactionlab.org/evaluation/impact-public-transport-labor-market-outcomes-pakistan
Franklin S. Location, search costs, and youth unemployment: A randomized trial of transport subsidies in Ethiopia. CSAE Working Paper [Internet]. 2015; Available from: https://academic.oup.com/ej/article-abstract/128/614/2353/5230959?redirectedFrom=fulltext
Martínez D, Mitnik OA, Salgado E, Scholl L, Yañez P. Connecting to Economic Opportunity: The Role of Public Transport in Promoting Women’s Employment in Lima [Internet]. 2018 Dec. Available from: https://publications.iadb.org/en/connecting-economic-opportunity-role-public-transport-promoting-womens-employment-lima
Morten M, Bryan G, Siddiqi B, Balboni C. Evaluating the impacts of the Dar es Salaam Bus Rapid Transit (BRT) System [Internet]. 3ie Series Report; 2020 Mar. Available from: https://www.3ieimpact.org/evidence-hub/publications/impact-evaluations/evaluating-impacts-dar-es-salaam-bus-rapid-transit
Scholl L, Oviedo D, Innao M, Pedraza L. Do Bus Rapid Transit Systems Improve Accessibility to Jobs?: The Case of Lima, Peru [Internet]. IDB Working paper series; 2018 Dec. Available from: https://publications.iadb.org/en/do-bus-rapid-transit-systems-improve-accessibility-jobs-case-lima-peru
Solnik EK, Malik A, Irvin-Erickson Y. Who benefits from bus rapid transit? Evidence from the Metro Bus System (MBS) in Lahore. Journal of Transport Geography [Internet]. 2018;71:139–49. Available from: https://www.sciencedirect.com/science/article/abs/pii/S0966692317304118
Write to us to know more and to get in touch: smalhotra@campbellcollaboration.org or southasia@campbellcollaboration.org.

‘The Transport Evidence and Gap Map was funded by the Centre of Excellence for Development Impact and Learning, supported by UK aid from the UK Government.’


