

What does it take to map an institution’s evidence?
Every year governments, donors, research programmes and a host of other entities commission evaluations. Each seeks to answer short- and long-term questions about a programme, a policy or an intervention. In doing so, they often follow a familiar lifecycle. Evaluations are first commissioned, then produced, published and quite often forgotten. Evidence and gap maps (EGMs) have the capacity to interrupt that final stage. Evaluations can have value well beyond the lifetime of a programme, and evidence mapping can give evaluations this second life.
This blog brings together learnings from an insightful but incredibly demanding mapping exercise: a rapid EGM of all available evaluations commissioned by the Foreign, Commonwealth & Development Office (FCDO), UK and published between January 2012 and April 2025. The FCDO Evaluations EGM brings together 1,436 evaluations with the findings described in detail in the accompanying report. But there is something larger that can be understood and taken forward by reflecting on the ideas, decisions and challenges that form the backbone of this map.
In this respect, the map serves two important functions. First, it makes FCDO’s evaluations visible and discoverable in a single place. Second, it enables those evaluations to be viewed collectively, allowing patterns and relationships to emerge that remain invisible when studies are considered in isolation.
When I first began working on the evidence map, I assumed the greatest challenge would be analysing the evaluations themselves. Instead, the first challenge was finding them. Not because evidence doesn’t exist, but because it is rarely in one place.
Large institutions such as FCDO generate vast amounts of knowledge through directly commissioned evaluations, evaluations commissioned through funded research programmes, and diverse partnerships that support evidence generation and learning. This knowledge is dispersed across programme websites, government repositories, research portals, annual reports, journal articles, organisational archives, and sometimes webpages that no longer exist. Reports may be published under the name of a partner organisation, embedded within larger programme documents, or lack the metadata needed to clearly identify their origins. Some evaluations are easy to locate. Others seem to disappear into the institutional record almost as soon as they are published. Some don’t even clearly identify themselves as evaluations. Before an evidence map can reveal patterns, someone first has to reconstruct an institution’s memory.
Bringing together more than a decade of FCDO-commissioned evaluations required piecing together evidence from over one hundred research and evaluation programmes, screening thousands of records, tracing funding acknowledgements, consulting annual reports where dedicated databases did not exist, and adapting search strategies to the realities of each source. As the work progressed, we began to think of the exercise less as evidence mapping and more as reconstructing institutional memory. Evaluations are often commissioned to answer immediate questions about programme performance, effectiveness or accountability. Once those questions have been addressed, the reports remain, but their visibility can diminish over time. New priorities emerge, websites are redesigned, programmes conclude, and institutional knowledge becomes increasingly difficult to navigate. Evidence mapping offers a way of interrupting that process. By bringing evaluations together within a common framework, it reconnects studies that were never designed to sit alongside one another. It makes evidence discoverable, searchable and interpretable at a portfolio level.
But recovering institutional memory is only the first step. Once evidence is brought together, a different question emerges. What can we learn from the structure of that knowledge itself?
EGMs can be quite unassuming. At first glance, they can seem like a catalogue of existing evidence. The FCDO Evaluations EGM could similarly be described as a collection of evaluations commissioned by FCDO. That, however, captures only part of its value. A deeper meaning emerges when we view the map as revealing the shape of FCDO’s evidence ecosystem: its structure, relationships, balance and empty spaces. Evidence is brought together in ways that reveal institutional priorities, connections across themes and sectors, areas of strength, and important blind spots. What becomes visible is the shape of an institution’s accumulated knowledge.
The concept of “evidence architecture” provides a useful way of thinking about this. White (2021) describes the strategic use of EGMs in building evidence architecture, showing how maps can identify priorities for future evidence generation, guide the commissioning of evidence syntheses, and support the development of evidence products for decision-making. In this conception, evidence architecture refers to a progressively curated set of evidence products that enables knowledge to move from production to use. Evidence maps occupy a central position, helping identify where evidence is sufficient for synthesis, where important gaps remain, and how future investments in evidence generation and synthesis can be strategically prioritised.
This strategic function of maps is reflected in our own work. The Research & Evaluation Centre (REC), along with partners such as Campbell South Asia, uses maps to identify reviews that can then be developed into evidence products for decision-making.
Working on the FCDO map encouraged me to think about evidence architecture from a complementary perspective. Alongside its role in supporting evidence use, we can look at the structure that emerges over years of decisions about what to fund, what to evaluate, what to publish and what to preserve. What happens when a map brings together an institution’s accumulated evaluations and allows them to be viewed collectively? What becomes visible about the institution itself? In making these patterns visible, a map enables institutions to understand what they know, reflect on how that knowledge has been built, and consider how it might evolve in the future.
The FCDO map offers some striking examples. Of the 1,436 evaluations brought together in the map, 84% are primary evaluations, and impact evaluations alone account for 63% of the full portfolio. Geographically, 55% of evaluations cover Sub-Saharan Africa, followed by 24% covering Southern Asia. Thematic concentrations are equally visible: economic development, education, and health and wellbeing feature prominently, while urban development and environmental sustainability receive comparatively less evaluative attention.
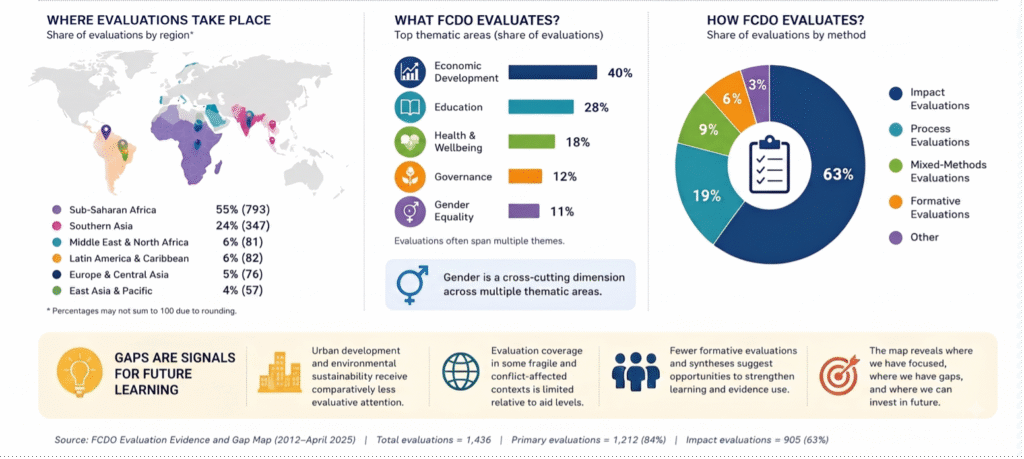
Looking across the portfolio also reveals relationships that individual studies rarely show. Gender, for example, appears as a cross-cutting dimension across several sectors. The dominance of impact evaluations, alongside the comparatively limited number of formative evaluations and evidence syntheses, raises questions about how institutional learning is generated and consolidated. Geographic patterns reveal another dimension: the concentration of evaluations does not always correspond with aid allocation, with comparatively limited published evaluation coverage in some fragile and conflict-affected contexts despite substantial aid investment.
Areas receiving comparatively limited evaluative attention are part of the picture too. They signal where institutional attention has been concentrated, where it has been limited, and where opportunities for future learning may lie. The map therefore offers a window into how an institution has built, organised and invested in its knowledge over time.
It is important, however, to recognise that the picture presented by a map does not emerge from the evaluations alone. It is also shaped by methodological choices made throughout the mapping exercise. A key challenge is deciding how evaluations should be understood, classified and represented. How should studies spanning multiple outcomes or sectors be categorized? How much detail can realistically be captured across more than a thousand evaluations without compromising consistency? And when funding attribution is unclear, what level of evidence is sufficient to establish inclusion? Within the FCDO evaluation portfolio, reports often lacked abstracts, outcomes were described using different terminologies, studies cut across multiple thematic areas, and funding relationships were not always straightforward to establish.
The aim here was to create a map that is transparent, coherent and useful, while recognising that alternative choices may produce a somewhat different representation of the evidence landscape. Recent methodological research on EGMs similarly points to substantial variation in how maps are designed and reported, reinforcing the importance of transparency about the choices involved.
The FCDO EGM sets out to capture FCDO’s evaluation ecosystem and, in the process, provides a case study for something much larger. Governments, UN agencies, development banks, NGOs, foundations, universities and large research programmes all have evidence ecosystems. Many may not know their full shape, because evidence remains dispersed across programmes, repositories, departments and time. Mapping provides a way to ask important questions. What have we invested in? Where are our blind spots? What do we keep evaluating? What have we neglected? Where should synthesis happen next? What should we stop duplicating?
The opportunity now is to think more deliberately about what happens after an institution’s evidence has been mapped. A clearer view of an evaluation portfolio can inform what should be evaluated next, where existing evidence should be synthesised rather than duplicated, which areas require greater attention, and how evidence can be better preserved for future use. For FCDO, the map provides a foundation for asking these questions across more than a decade of evaluation activity. For other governments, funders and organisations, it offers a case for looking inward at the evidence they have already generated and asking what that accumulated knowledge can tell them about where to go next.
References
Miake-Lye, I. M., Hempel, S., Shanman, R., & Shekelle, P. G. (2016). What is an evidence map? A systematic review of published evidence maps and their definitions, methods, and products. Systematic Reviews, 5, 28.
White, H. (2021). The strategic use of evidence and gap maps to build evidence architecture. CEDIL Methods Working Paper 5. Centre of Excellence for Development Impact and Learning.
White, H. (2021). Evidence and gap maps: Using maps to support evidence-based development. CEDIL Methods Brief 6. Centre of Excellence for Development Impact and Learning.
Fredlund, M., et al. (2024). What are the methodological characteristics of evidence and gap maps? A systematic review and evidence and gap map. Cochrane Evidence Synthesis and Methods.




About Post Author